UPDATES: June 2018
Source reduction in small watersheds to improve urban water quality
June 2018 (volume 13 - issue 3)
Contributed by Sarah E. Hobbie1, Jacques C. Finlay1, Ben A. Janke1,2, Lawrence A. Baker3, and Paula Kalinosky4
1Dept. of Ecology, Evolution and Behavior, University of Minnesota
2Saint Anthony Falls Laboratory, University of Minnesota
3Dept. of Bioproducts and Biosystems Engineering, University of Minnesota
4Emmons and Olivier Resources
Funded by the University of Minnesota Institute on the Environment, the National Science Foundation, the Environmental Protection Agency, Capitol Region Watershed District, and the Water Resources Center.
Despite years of effort to improve urban water quality, many lakes and streams in urban regions still suffer from impaired water quality, largely because of excessive loading of nutrients, particularly phosphorus (P), but also likely nitrogen (N) (Paerl et al. 2016). Traditional approaches to addressing urban water quality issues have mostly focused on monitoring impaired water bodies and engineering structures or mechanisms to trap nutrients within or directly upstream of the focal water body. Yet, despite a lot of effort and money spent cleaning up urban lakes, streams, and rivers, poor urban water quality persists, suggesting that additional approaches are needed. Here we discuss how ecological approaches, specifically the “small watershed approach” to addressing impaired urban water quality, can point to potential additional solutions to improve persistent urban water quality issues.
The Small Watershed Approach
Pioneered in the 1960s in the northeastern United States, the small watershed approach has been used by ecologists and hydrologists to gain insights about water and element cycling in forested catchments. Researchers have used this approach to construct “input-output” budgets, measuring all of the water and elements coming into a watershed through atmospheric deposition, and comparing them to the water and elements leaving the catchment in stream water, because little water moves to groundwater in these bedrock-dominated sites (Likens and Bormann 1995). Such comparisons help reveal how disturbances like fire or logging change plant uptake of water and nutrients and how pollutants are processed within the watershed’s soils and vegetation.
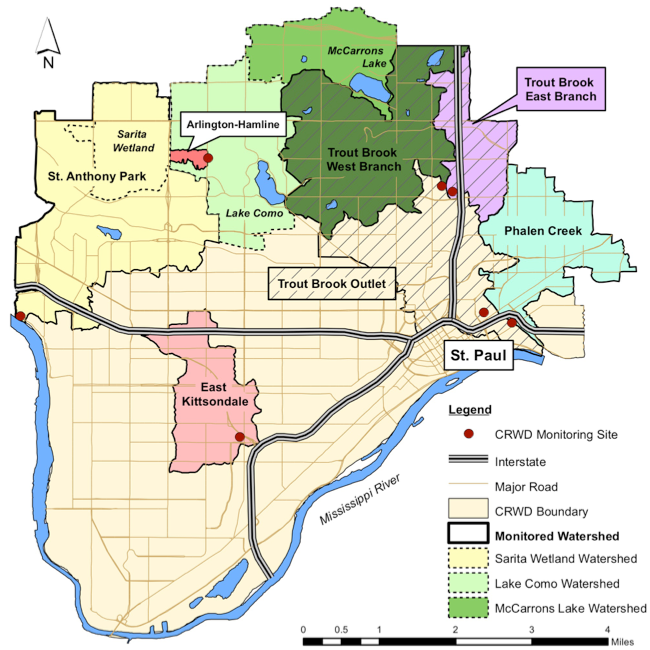
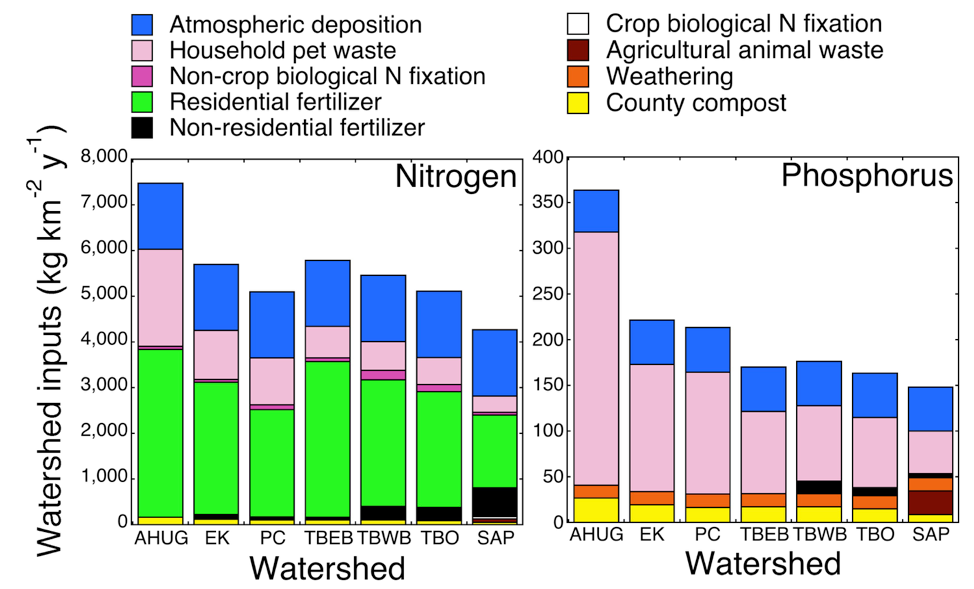
Taking our cue from these past studies, we used a small watershed approach in urban watersheds in the Twin Cities Metropolitan Region (Hobbie et al. 2017), in partnership with the Capitol Region Watershed District, to construct input-output budgets (see Box 1) for seven subwatersheds of the Mississippi River in Saint Paul and adjacent suburbs (Fig. 1). Using a variety of methods, including surveys of homeowners and resource managers for golf courses and campuses, computer models, on-the-ground measurements, and published results, we estimated the new inputs of N and P to the watersheds (Fig. 2). Unlike more pristine watersheds, urban watersheds have inputs of N and P from sources in addition to atmospheric deposition, including residential and non-residential fertilizer, pet waste (the fraction of N and P in pet food that ends up in the landscape in urine and feces), and compost that is brought in from outside of the watersheds. Just like non-urban watersheds, urban watersheds contain plants that are able to “fix” atmospheric N into biologically available forms, so we estimated those inputs, as well. In addition, we considered P that is released into biologically available forms from rock weathering to be an “input” to the watershed. Although residents also import N and P in their own food, we excluded these inputs from our budgets because nutrients in food end up in the sanitary sewer system and ultimately the Metropolitan Wastewater Treatment Plant, bypassing the study watersheds.
|
Box 1. Definitions. New Watershed Inputs Watershed Outputs Input-Output Budget Watershed Retention Litterfall |
Figure 1. Map of the Capitol Region Watershed District (CRWD), including monitored watersheds that were part of studies mentioned here: Arlington-Hamline (AHUG), East Kittsendale (EK), Phalen Creek (PC), Saint Anthony Park (SAP), Trout Brook East Branch (TBEB), Trout Brook Outlet (TBO), and Trout Brook West Branch (TBWB).
Figure 2. Sources of new inputs of nitrogen (left) and phosphorus (right) to monitored CRWD watersheds. Watersheds are arranged left to right from most residential to least residential. Abbreviations as in Fig. 1 legend. Figure from Hobbie et al. 2017. Proc Natl Acad Sci USA 114:4177-4182.
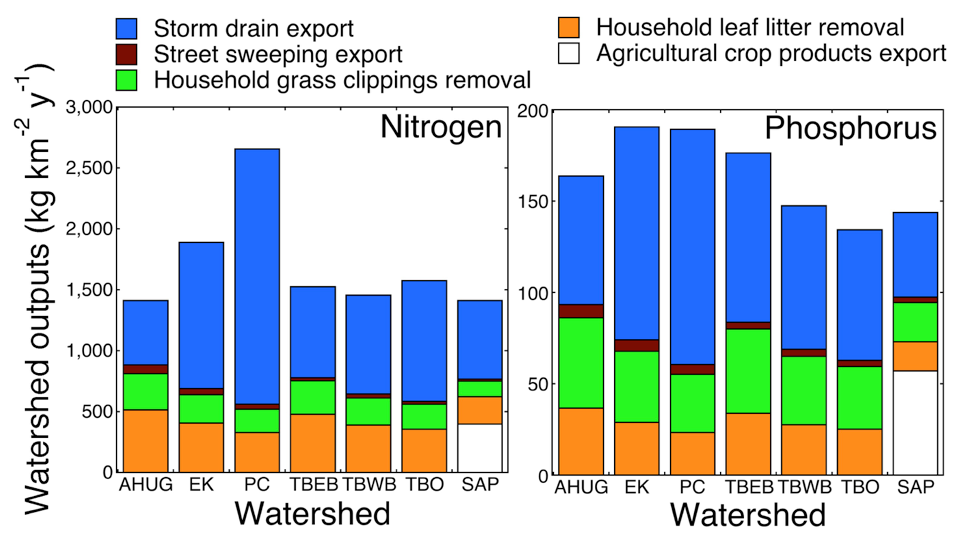
We compared our estimates of new inputs of N and P to the watersheds to estimates of watershed outputs of N and P (Fig. 3) (Hobbie et al. 2017). In addition to N and P exported in stormwater, we estimated nutrients exported during baseflow periods (in between rain and snowmelt events) in stormdrains (Janke et al. 2014), nutrients removed from watersheds by homeowners who take yard waste to county collection sites, and nutrients removed from watersheds during semi-annual street sweeping operations, when leaf material is swept up and taken out of the watersheds.
Figure 3. Watershed outputs of nitrogen (left) and phosphorus (right) from monitored CRWD watersheds. Watersheds are arranged left to right from most residential to least residential. Abbreviations as in Fig. 1 legend. Figure from Hobbie et al. 2017. Proc Natl Acad Sci USA 114:4177-4182.
Identifying Watershed Nutrient Leaks
Nutrient input-output budgets revealed that urban watersheds are very susceptible to losing P into storm water, which is bad news for downstream surface waters. New inputs of P to the watersheds were dominated by pet waste, rather than fertilizer, because of the state-wide restriction on use of P in lawn fertilizer in Minnesota, whereas new inputs of N were dominated by residential fertilizer and atmospheric deposition (Fig. 2). Urban watersheds differed greatly from more pristine, non-urban watersheds in having limited capacity to “retain” these P inputs (Box 1, Fig. 4). In fact, on a yearly basis, the amount of P exported via storm drains on average across the watersheds was almost as high as the amount of new P coming into the watersheds, and in one watershed, there was more P leaving the watershed each year than was coming in from new inputs. On a watershed area basis, rates of P losses from storm drains were very high and similar to or exceed those observed in agricultural watersheds in southern Minnesota (Minnesota Pollution Control Agency 2004, Boardman 2016).
Figure 4. Relationships between net watershed inputs of nitrogen or phosphorus (new inputs minus removal through yard waste and street sweeping) and storm drain export (in runoff, baseflow, and total [runoff + baseflow]). Each symbol represents a watershed, but AHUG is excluded. Relationships were not significant for N. P in runoff = 0.7 + 0.5 * net P inputs (P = 0.02, R2 = 0.80); P in baseflow = 9.7 + 0.2 *net P inputs (P = 0.15, R2 = 0.44); and total storm drain P export = 10.4 + 0.7 *net P inputs (P = 0.009, R2 = 0.85). The dashed line indicates a 1:1 line, where net inputs = output. Values below the line indicate net loss of nutrients from the watershed, while values above the line indicate net retention in the watershed. Figure from Hobbie et al. 2017. Proc Natl Acad Sci USA 114:4177-4182.
Nitrogen tells a slightly different story. In contrast to P, only about 20% of the new inputs of N to urban watersheds were exported in storm drains each year on average (Fig. 4). Where the rest of it went is a bit of a mystery. However, our estimates suggest that rather than accumulating within the watershed in plants or soils, it was probably being leached as nitrate to groundwater, and possibly emitted to the atmosphere in gaseous forms from soils.
So, why are urban watersheds so “leaky”, especially for P? In other words, how do watershed nutrient inputs, that enter watersheds primarily in residential landscapes, make their way into streets, storm drains, and downstream lakes and rivers? We have identified several key processes that move N and P from land into streets, storm drains, and urban surface waters. These sources of N and P to streets and storm drains include: (1) litterfall (Box 1), (2) lawn runoff during heavy rain events, and (3) spring snowmelt, which mobilizes nutrients from multiple sources. We discuss each of these in turn.
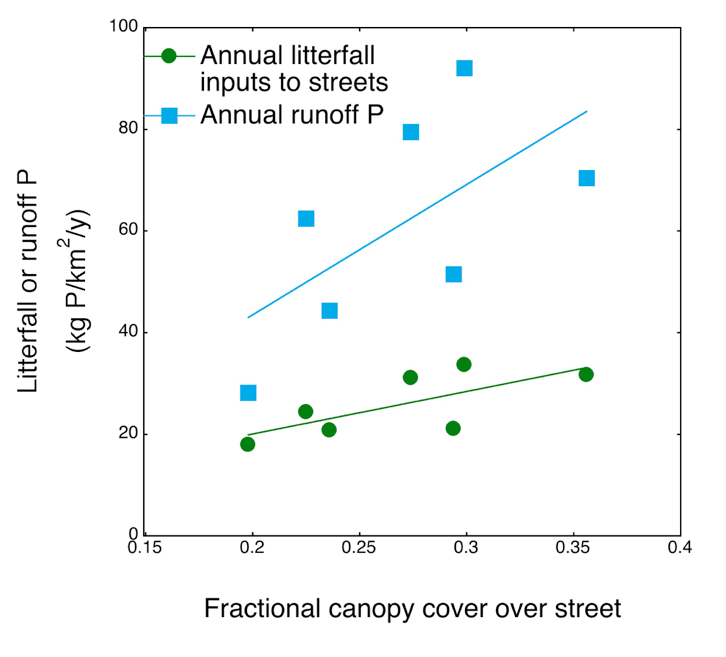
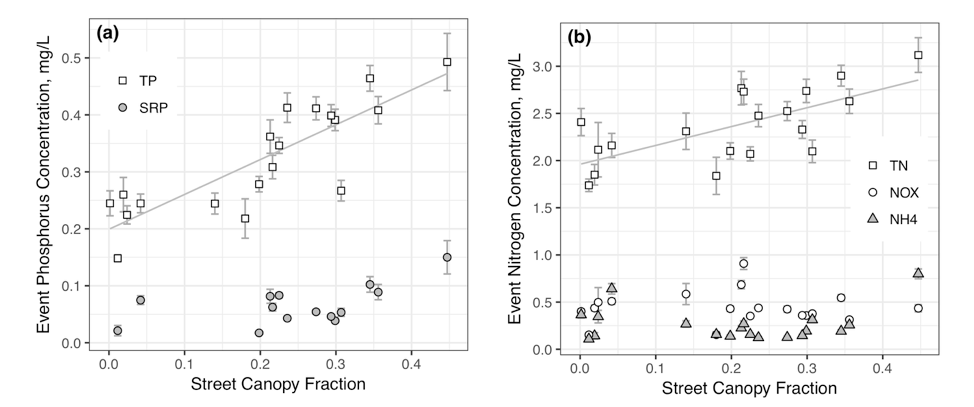
Litterfall is a key source of nutrients to streets, storm drains, and surface waters because leaves are rich in N and P, and trees only reabsorb about half of the nutrients in their leaves when their leaves turn color in the fall and drop to the ground or pavement. As a result, trees adjacent to streets and other paved surfaces effectively act as nutrient “pumps”, taking up nutrients from the soil (that might have originated ultimately from atmospheric deposition, pet waste, rock weathering, or fertilizer), investing those nutrients in their leaves (as well as their pollen, flowers, seeds, etc.), and then depositing some fraction of those nutrients in the litterfall. Once litterfall hits the street, there is nothing to prevent litterfall nutrients from moving into the storm drain, unless they are removed from streets by street sweeping or by residents, or from catch basins through maintenance efforts. Soluble nutrients will be washed out of the litter and down the drain as soon as it rains; the remaining nutrients will gradually be solubilized and become available to organisms like algae as the litter decays. Our research suggests that between 37-64 percent of the P exported in storm drains comes from litterfall in residential neighborhoods of Saint Paul with relatively high tree canopy cover (Fig. 5). Accordingly, stormwater N and P concentrations were highly correlated with tree canopy cover over streets across 14 watersheds across the Twin Cities Metropolitan Area (Fig. 6) (Janke et al. 2017). Further, within a small residential watershed, stormwater nutrient concentrations varied over the season with peaks that corresponded to periods of peak litterfall both in the spring, when trees drop bracts, flowers, and seeds, and in the fall during leaf drop (Finlay et al. unpublished). These results all support the conclusion that litterfall is an important way that nutrients move into streets and storm drains, and ultimately into urban lakes, streams, and rivers.
Figure 5. Relationships between fractional tree canopy cover over streets and estimated annual litterfall P inputs to streets and annual stormwater runoff P, on a watershed-area basis, for the CRWD monitored watersheds (each represented by a point). Litterfall inputs to streets were estimated using statistical models that predict annual litterfall loads as a function of tree canopy cover over streets (determined for each CRWD watershed from tree canopy maps of Kilberg et al. 2011); models were developed using street sweeper loads from routes swept weekly during the entire snow-free period as part of the Prior Lake Street Sweeping Study (Kalinosky et al. 2014, 2015). Estimates of annual litterfall inputs to streets account for litter swept during biannual spring and fall street sweeping.
Figure 6. Stormwater event mean phosphorus (a) and nitrogen (b) concentrations as a function of fractional canopy cover over the street across 14 watersheds in the Twin Cities Metropolitan Area. Figure reprinted with permission from Janke et al. Environmental Science & Technology 51 (17):9569-9579. Copyright 2017 American Chemical Society.
A second key source of nutrients to streets and stormwater, and another pathway by which nutrients are lost from urban watersheds to urban surface waters is runoff from lawns during heavy rain events. Our research suggests that heavy rainfall events are particularly important for washing nutrients from urban landscapes into streets (Finlay et al. unpublished). These nutrients are mostly in dissolved forms that likely wash out of turf grasses, trees, and surface soils, but also include nutrients washed into streets as small particles (eroding soil and vegetation fragments). Intense rainfall creates high “hydrologic connectivity” between yards and streets, whereby water carrying nutrients washes over land from all parts of the urban landscape into streets and storm drains.
Nutrients mobilized during snowmelt are a third key source of nutrients to stormwater. Our research and past studies have shown that a large fraction of urban runoff occurs during snowmelt. For instance, in one urban residential watershed in CRWD, about one-third to one-half of the P in annual runoff was exported during snowmelt (Bratt et al. 2017). Nutrients in snowmelt likely originate from a variety of sources, including leaf litter that overwinters in the street, runoff over the surface of frozen soils (Bierman et al. 2010), and atmospheric deposition that collects on the snow during the winter.
Implications for Management
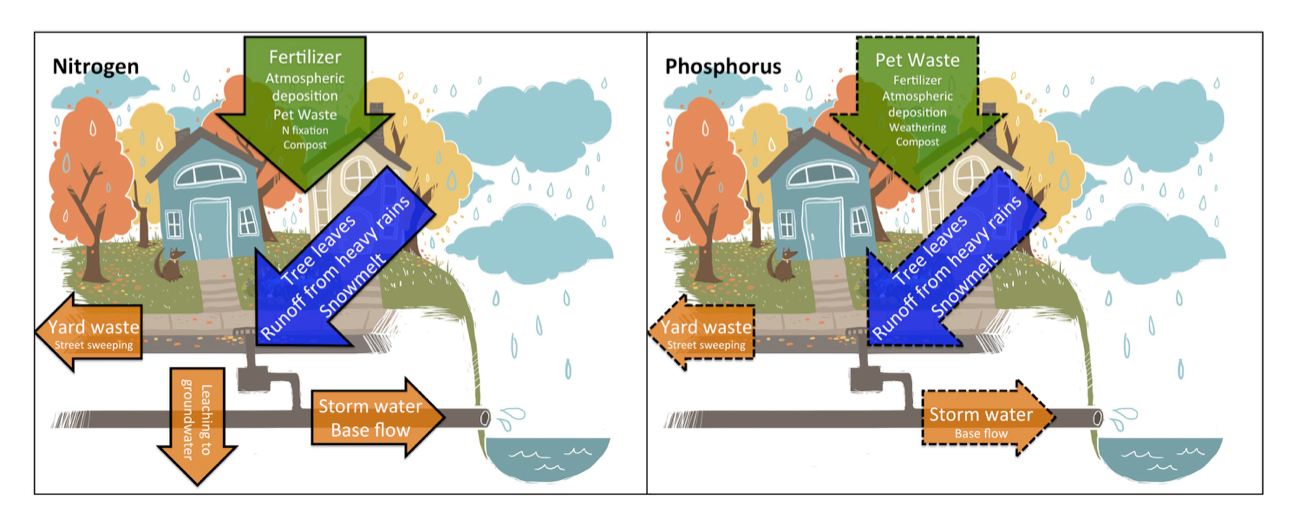
Watershed input-output budgets (Fig. 7), especially when combined with other research, provide insights into how efforts to clean up impaired urban waters could be enhanced.
Figure 7. Overview of the major new inputs (green arrows) and outputs (orange arrows) of nutrients to and from urban watersheds, and processes that move nutrients from land to streets and stormdrains (blue arrows) for nitrogen (left panel, solid outlines) and phosphorus (right panel, dashed outlines). Font size within an arrow roughly indicates relative importance of different processes, with larger text indicating flows of larger magnitude.
Focus on New Inputs for N
Reducing new inputs of nutrient pollutants to watersheds could be effective for reducing N exported to ground and surface water. Household fertilizer was the dominant new input of N to watersheds, and reducing fertilizer N inputs not only could reduce lawn runoff and N inputs to storm drains, but possibly N losses to groundwater. Households vary tremendously in their N fertilizer use, and 24% of households in CRWD fertilize at rates higher than those recommended by the University of Minnesota Extension Service (Fissore et al. 2011b). Variation in household fertilizer use in the Twin Cities is related to a number of different factors (Martini et al. 2015), but homeowner education regarding over-fertilization could reduce watershed N inputs since homeowners who are more knowledgeable about their lawn management practices are more likely to use best management practices related to fertilizing (Martini and Nelson 2015), and those who know that stormwater receives no treatment or that fertilizer can contribute to pollution are less likely to fertilize (Martini et al. 2015). Lawn care companies would be appropriate to target for N fertilizer reductions, since fertilizer rates by lawn care companies exceeded the recommended rates for most lawns in the region (Fissore et al. 2011a, University of Minnesota Extension Service). In contrast to N, the low-hanging fruit has already been picked for P in the form of a statewide lawn P fertilizer restriction. Substantial additional reductions in new P inputs to these watersheds are likely not feasible, given that regulating dog ownership in impractical; nevertheless, emphasizing the importance of picking up after dogs is worthwhile as about half of the landscape inputs of P from pet waste derive from feces (as opposed to urine) (Fissore et al. 2011a).
Source Reduction to Streets
There is a large untapped opportunity to reduce the substantial nutrient loss from land to water associated with litterfall through efforts by cities, citizen groups, and individuals. Municipal street-sweeping operations could be expanded and/or focused on sweeping when and where it will do the most good. Since canopy cover over streets is closely related to P concentrations in stormwater (Janke et al. 2017), high-resolution tree canopy maps and street tree inventories, could help cities prioritize sweeping routes to achieve the greatest reduction in nutrient loading. Increasing the frequency of street sweeping of streets with high tree canopy cover in autumn can be an efficient use of funding, bringing costs of P removal below $100/pound (Kalinosky et al. 2014). Active participation of individuals and citizen groups concerned with local water in efforts to reduce nutrients entering streets is increasing. For example, the Como Active Citizen Network mobilizes a volunteer network to remove leaf litter from street gutters before leaf litter is washed into storm drains or nutrients are leached from leaves (http://www.comoacn.org). Adequate education of individuals involved in these efforts is needed to ensure that gutters are cleaned frequently enough and that timing of efforts matches the timing of litterfall. Individuals and landscaping companies also can improve nutrient management via lawn care methods that use the least amount of N fertilizer to achieve healthy grass, collecting and composting grass clippings, and ensuring that as little fertilizer or yard waste enters the streets. Given the many other benefits of trees and other vegetation in cities, source reduction via litter and lawn management could promote improved environmental quality in both terrestrial and aquatic habitats of urban ecosystems.
Restoring Hydrologic Function
Best Management Practices (BMPs) that intercept runoff from impervious surfaces and infiltrate water into the ground provide benefits for improved hydrological function of streams and lakes, and can trap nutrients that would otherwise enter surface waters. Rain gardens are one example of a BMP that can be employed by homeowners, cities, and watershed managers to help reduce excess nutrients. Rain gardens trap P in soils and vegetation, and may promote denitrification of N (LeFevre et al. 2014). Where space for rain gardens is limited, such as high-density neighborhoods and heavily developed commercial areas, alternatives such as tree trenches and underground infiltration areas can provide similar functions, although installation and maintenance is considerably more expensive. Given the difficultly in preventing all nutrient sources from moving onto streets and into storm drains, continued expansion of BMPs for downstream capture of nutrient runoff will play an essential role in improving water quality and hydrology of cities.
References
- Bierman, P. M., B. P. Horgan, C. J. Rosen, A. B. Hollman, and P. H. Pagliari. 2010. Phosphorus runoff from turfgrass as affected by phosphorus fertilization and clipping management. Journal of Environmental Quality 39:282-292.
- Boardman, E. 2016. Nutrient dynamics in Minnesota watersheds. Master of Science. University of Minnesota, Saint Paul, MN.
- Bratt, A. R., J. C. Finlay, S. E. Hobbie, B. D. Janke, A. C. Worm, and K. L. Kemmitt. 2017. Contributions of leaf litter to nutrient export during winter months in an urban residential watershed. Environmental Science & Technology 51:3138-3147.
- Fissore, C., L. A. Baker, S. E. Hobbie, J. Y. King, J. P. McFadden, K. C. Nelson, and I. Jakobsdottir. 2011a. Carbon, nitrogen, and phosphorus fluxes in household ecosystems in the Minneapolis-Saint Paul, Minnesota, urban region. Ecological Applications 21:619-639.
- Fissore, C., L. A. Baker, S. E. Hobbie, J. Y. King, J. P. McFadden, K. N. Nelson, and I. Jakobsdottir. 2011b. Carbon, nitrogen, and phosphorus fluxes in household ecosystems in the Minneapolis-Saint Paul, Minnesota, urban region. Ecological Applications 21:619-639.
- Hobbie, S. E., J. C. Finlay, B. D. Janke, D. A. Nidzgorski, and L. A. Baker. 2017. Contrasting nitrogen and phosphorus budgets in urban watersheds and implications for managing urban water pollution. Proceedings of the National Academy of Sciences 114:4177-4182.
- Janke, B., J. C. Finlay, and S. E. Hobbie. 2017. Trees and streets as drivers of urban stormwater nutrient pollution Environmental Science and Technology in press.
- Janke, B. D., J. C. Finlay, S. E. Hobbie, L. A. Baker, R. Sterner, D. Nidzgorski, and B. N. Wilson. 2014. Contrasting influences of stormflow and baseflow pathways on nitrogen and phosphorus export from an urban watershed. Biogeochemistry 121:209-228.
- Kalinosky, P. 2015. Quantifying solids and nutrient recovered through street sweeping in a suburban watershed. Master of Science. University of Minnesota, St. Paul, MN.
- Kalinosky, P., L. A. Baker, S. E. Hobbie, R. Bintner, and C. Buyarski. 2014. User support manual: Estimating nutrient removal by enhanced street sweeping. University of Minnesota.
- Kilberg, D., M. Martin, and M. Bauer. 2011. Digital Classification and Mapping of Urban Tree Cover: City of St. Paul. Contract CON25501, University of Minnesota, St. Paul, MN.
- LeFevre, G. H., K. H. Paus, P. Natarajan, J. S. Gulliver, P. J. Novak, and R. M. Hozalski. 2014. Review of dissolved pollutants in urban storm water and their removal and fate in bioretention cells. Journal of Environmental Engineering 141:04014050.
- Likens, G. E., and F. H. Bormann. 1995. Biogeochemistry of a Forested Ecosystem. 2 edition. Springer-Verlag, New York.
- Martini, N. F., and K. C. Nelson. 2015. The role of knowledge in residential lawn management. Urban Ecosystems 18:1031-1047.
- Martini, N. F., K. C. Nelson, S. E. Hobbie, and L. A. Baker. 2015. Why “Feed the Lawn”? Exploring the influence of residential turf grass fertilization in the Minneapolis-Saint Paul Metropolitan Area. Environment and Behavior 47:158-183.
- Minnesota Pollution Control Agency. 2004. Detailed assessment of phosphorus sources to Minnesota watersheds. submitted by Barr Engineering.
- Paerl, H. W., J. T. Scott, M. J. McCarthy, S. E. Newell, W. Gardner, K. E. Havens, D. K. Hoffman, S. W. Wilhelm, and W. A. Wurtsbaugh. 2016. It takes two to tango: When and where dual nutrient (N & P) reductions are needed to protect lakes and downstream ecosystems. Environmental Science & Technology.

![Figure 4. Relationships between net watershed inputs of nitrogen or phosphorus (new inputs minus removal through yard waste and street sweeping) and storm drain export (in runoff, baseflow, and total [runoff + baseflow]). Figure 4. Relationships between net watershed inputs of nitrogen or phosphorus (new inputs minus removal through yard waste and street sweeping) and storm drain export (in runoff, baseflow, and total [runoff + baseflow]).](/sites/stormwater.safl.umn.edu/files/files/media/2018-jun4.png)
